
This repository contains the code for three distinct solutions developed for the Enefit Kaggle challenge. ⭐️
Our approaches span from LSTM networks to Transformer architectures, culminating in an ensemble model that combines the strengths of each method. 🦾
Our goal is to highlight the differences, strengths, and weaknesses of various architectures when tackling the same forecasting problem.
Note: This folder contains a refactored version of the original Kaggle notebook. As a result, replicating the experiments may require additional effort to write missing scripts and adjust file paths.
📖 Challenge Overview
From the official page of the challenge:
The goal of the competition is to create an energy prediction model of prosumers to reduce energy imbalance costs.
This competition aims to tackle the issue of energy imbalance, a situation where the energy expected to be used doesn’t line up with the actual energy used or produced. Prosumers, who both consume and generate energy, contribute a large part of the energy imbalance. Despite being only a small part of all consumers, their unpredictable energy use causes logistical and financial problems for the energy companies.
Solving this challenge will help to improve energy management, reducing waste and costs!
💾 Data
The dataset used can be downloaded directly from the challenge page. It consists of a CSV file that includes:
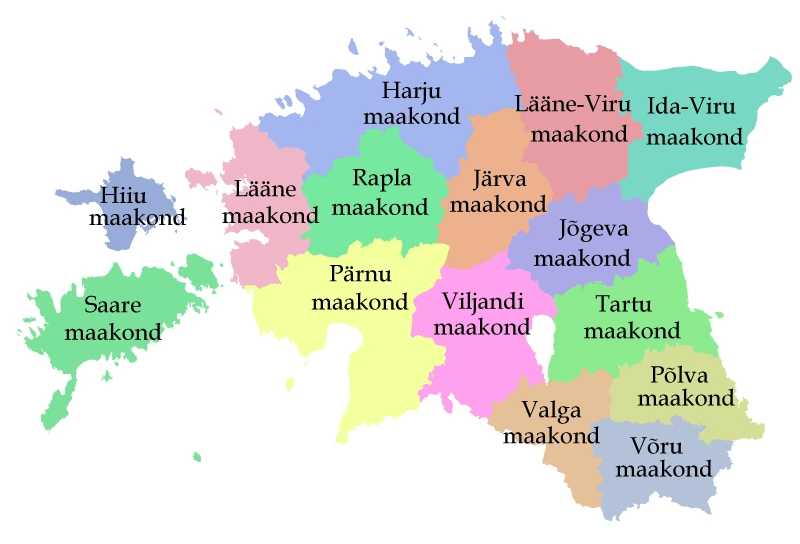
🌍 Geographical information, a grid of coordinates for meteorological stations, zip code of customers…
🌤️ Weather data, snow on the ground, solar radiation, temperature…
💰 Relevant energy prices
☀️ Records of installed photovoltaic (PV) capacity
🕝 Accurate timestamp
⚙️ Feature Engineering
To enhance the predictive power of our models, we applied some preprocessing and feature engineering techniques:
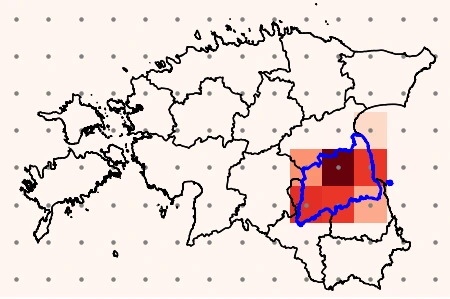
🌤️ Weather Data Grid, the raw weather data was initially available on a grid of geographic points.
We used convex interpolation to summarize this data on a per-county basis across Estonia, aligning it with administrative boundaries.
This step was essential for capturing regional variations and aggregating data in a meaningful way.
🔁 Scaling, continuous features were standardized using Z-score normalization to ensure stable training behavior across all models.
🏷️ Categorical Features, categorical variables were processed using One-Hot Encoding, preserving their discrete nature while making them suitable for model input.
🕝 Lag feature, showed to increase the predictive power of the models.
🚀 Models
We implemented three structurally distinct models to solve the challenge:
1️⃣ A classical LSTM encoder-decoder using temporal attention to compute contextual information.
2️⃣ A Transformer utilizing AdaLN-Zero and specialized attention heads: time-wise, contract-wise, and county-wise.
3️⃣ A hybrid model combining the above: a transformer encoder with relative attention layers and a non-autoregressive LSTM decoder, using categorical embeddings.
Model implementations can be found under src/enefit/models.
📊 Results
We tested the three different models on the same test-set, evaluating each in terms of Mean Absolute Error (MAE) for both production and consumption.
| Model | Avg MAE | Prod. MAE | Cons. MAE | Params |
|---|---|---|---|---|
| LSTM Encoder-Decoder | 95.01 | 128.57 | 61.45 | ~500K |
| Specialized Transformer | 64.86 | 72.24 | 57.45 | 3.2M |
| Hybrid Transformer-LSTM | 81.35 | 98.67 | 64.03 | 188K |
| Ensemble (LSTM + Transformer) | 63.5 | - | - | - |
While the ensemble model slightly outperformed the specialized transformer (by 1.3 MAE points), it offered no substantial gain over the best individual solution.
✅ Summary
The specialized transformer (AdaLN-Zero with multi-context attention) consistently delivered the best performance across all metrics, showing how a well-structured transformer can outperform classical recurrent models even on structured tabular time series data.
📚 Resources
Our first approach follows the paper, Shengdong Du, et al.
Our second approach implements paper, William P., Saining X.
While our third is based on paper, P. Shaw, et al.